
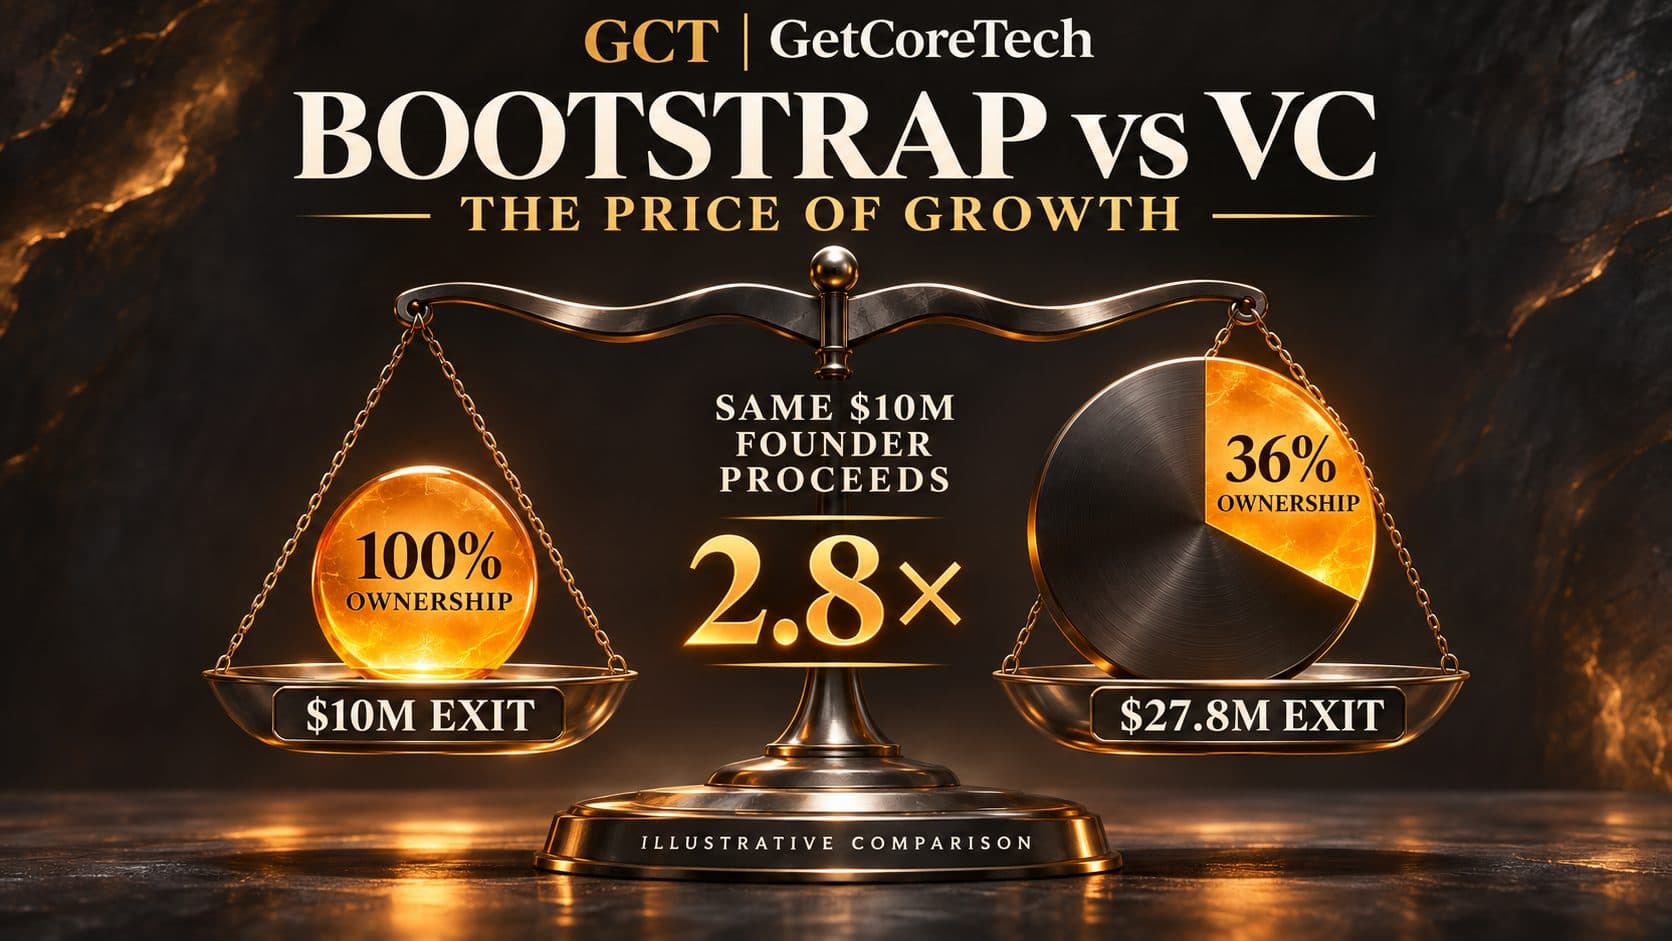
Venture funding moves a median founding team from about 56% ownership after seed to 36% after Series A, according to Carta's 2026 report.1 Only 0.6% of employer firms received venture capital at the start in the 2014 Annual Survey of Entrepreneurs, the data behind a Kauffman Foundation briefing.2 The decision turns on one comparison: whether your market can produce an exit large enough that 36% of it beats all of a smaller one.
A round costs about a fifth of the company, and the stakes compound
Measured Carta's 2026 Founder Ownership Report puts the median founding team at about 56% of fully diluted equity after a seed round and 36% after Series A. The data covers primary venture rounds from 2021 to 2025, as a snapshot on 1 January 2026, for U.S.-incorporated founders who held at least 5% before fundraising.1
A separate Carta analysis by Peter Walker, published 4 September 2024, measured the investor's slice of each round. It found a median of about 20% at seed and about 20% at Series A, with the 75th percentile just under 25%, across more than 9,600 priced U.S. software rounds since 2021.3
CRV, a venture firm, cites a further median of about 23% founder ownership after Series B.4 Each step comes out of the same founders.
The money trail: who pays and who gets what
| Party | Pays | Gets | Source |
|---|---|---|---|
| Founders, bootstrapped | Personal and family savings, bank loans and personal credit cards; 10.3% of entrepreneurs used a personal card (2014 data) | All of the equity, no investor on the cap table | 2 |
| Seed investor | Cash for a median of about 20% of the company | Preferred shares; founders at a median of about 56% afterward | 13 |
| Series A investor | Cash for a median of about 20% | Preferred shares; founders at a median of 36% afterward | 13 |
| Lender (venture debt, revenue-based financing) | Repayment obligations; venture debt is typically sized at 25% to 50% of the last equity round | Extra runway with no new shares | 4 |
Worked number: the exit a venture round has to beat
This example is illustrative. It asks what sale price makes a founding team's dollar take equal to a $10 million sale of a company the team owns outright.
- Bootstrapped: 100% × $10,000,000 = $10,000,000.
- After Series A, using Carta's 36% median: $10,000,000 ÷ 0.36 = $27,777,778.
- After Series B, using the 23% median CRV cites: $10,000,000 ÷ 0.23 = $43,478,261.
The venture path has to reach roughly 2.8 times the bootstrapped sale price after Series A, and roughly 4.3 times after Series B, just to pay founders the same.14 The figures exclude liquidation preferences, which push the required price higher, and taxes and fees. They also exclude the reason to raise at all: money can change how fast and how large the company grows.
The option pool adds a second hidden cost. CRV's example: a $3 million investment at a $10 million pre-money valuation gives the investor $3M ÷ $13M = 23.1% either way. With a 10% post-money pool, founders hold 66.9%. With a 20% pool they hold about 56.9%, ten points lower, because the pool is created before closing and comes out of the founders' shares.4
Announced as growth capital, documented as a narrow channel
The industry's own totals show a market concentrated at the top. The NVCA 2026 Yearbook, with PitchBook data as of 31 December 2025, counts 15,352 U.S. venture deals worth $320 billion in 2025. The 487 deals of $100 million or more were 3.2% of deal count and 67% of total value. The top 10 funds took 32.9% of all venture capital raised, up from 13% in 2021.5
The Kauffman Foundation's December 2016 briefing, built on the 2014 Annual Survey of Entrepreneurs (about 290,000 employer businesses), found that 0.6% of firms initially received venture capital.2 That survey is more than ten years old.
Where the two Carta reports differ
Two rounds that each sell 20% leave a founder with 0.8 × 0.8 = 64% of a company that started at 100%. Carta's ownership report shows 36% at Series A, an implied fall from 56% to 36%, or 36 ÷ 56 = 0.64 of the seed-stage stake.13 The dilution report measures investors' slices of priced software rounds, and the ownership report measures where founders end up. Neither report reconciles the two, and the ownership report does not state its sample size. For planning, the ownership figure is the one that describes what founders are left holding.
What the documents don't say
None of these sources compares bootstrapped and venture-backed companies on the same outcome, such as survival, revenue or founder proceeds. None defines "bootstrapped" the same way. The return distribution that VC Beast describes for a typical early-stage fund (top 5% of deals drive 50% to 70% of returns) cites no data source, so this article does not use it as a measurement.6
Incentives: a fund needs outliers, and that shapes the advice
VC Beast, a secondary source, reports that Cambridge Associates data shows top-quartile venture funds targeting a net multiple of 3x or more over ten years, with median funds returning about 1.5x to 2x net. The article gives no data vintage.6 A fund aiming at 3x across a portfolio needs a few very large exits, so a $10 million outcome helps the founders and moves the fund's return very little.
The founder whose company is a good $10 million business is the person worse off after a venture round, because the cap table now needs a price near $28 million to pay the same. Opinion The investor's incentive and the founder's incentive match only above that price.
A third party, the lender, sits outside that fight. CRV says debt and revenue-based financing can extend a post-revenue company's runway but do not replace equity and carry repayment obligations. Its example: a $500,000 seed at 20% dilution plus $300,000 of revenue-based financing deploys $800,000 for the same 20%.4
Which path fits which company
The conditions that decide it:
- Venture funding fits when the company needs capital before revenue can pay for it, and the market could support an exit above the break-even in the worked number. CRV says pre-revenue companies often need equity for credibility, network access and follow-on support.4
- Bootstrapping fits when customers can pay for the next stage of growth, when the likely exit sits below the break-even, or when control matters more than pace. No source here measures what slower growth costs, so that term is the one to estimate yourself.
- Debt or revenue-based financing fits a company with recurring revenue that needs runway between priced rounds. Venture debt is typically 25% to 50% of the last equity round.4
Edge cases and mistakes from CRV: stacking SAFEs at different caps without modeling conversion causes over-dilution that stays hidden until a priced round, and raising right after a clear milestone, not when runway is low, supports higher valuations and less dilution.4
If you are not raising this year
A founder who is not raising can still run the break-even now: divide a realistic sale price by the ownership you would hold after the round you are considering. A result far above your realistic sale price means the venture path needs a larger market than yours.
An employee or advisor weighing equity in a venture-backed company can run it from the other side. Ask which round the company has closed and what it has told investors about exit size. Opinion A company funded for a very large outcome may not be free to choose a small sale.

Comments